快速入门#
欢迎来到 Flax!
Flax 是一个开源的 Python 神经网络库,建立在 JAX 之上。本教程演示了如何使用 Flax Linen API 构造一个简单的卷积神经网络 (CNN),并在 MNIST 数据集上训练该网络以进行图像分类。
1. 安装 Flax#
!pip install -q flax>=0.7.5
2. 加载数据#
Flax 可以使用任何数据加载管道,本示例演示了如何利用 TFDS。定义一个函数,该函数加载并准备 MNIST 数据集,并将样本转换为浮点数。
import tensorflow_datasets as tfds  # TFDS for MNIST
import tensorflow as tf             # TensorFlow operations

def get_datasets(num_epochs, batch_size):
  """Load MNIST train and test datasets into memory."""
  train_ds = tfds.load('mnist', split='train')
  test_ds = tfds.load('mnist', split='test')

  train_ds = train_ds.map(lambda sample: {'image': tf.cast(sample['image'],
                                                           tf.float32) / 255.,
                                          'label': sample['label']}) # normalize train set
  test_ds = test_ds.map(lambda sample: {'image': tf.cast(sample['image'],
                                                         tf.float32) / 255.,
                                        'label': sample['label']}) # normalize test set

  train_ds = train_ds.repeat(num_epochs).shuffle(1024) # create shuffled dataset by allocating a buffer size of 1024 to randomly draw elements from
  train_ds = train_ds.batch(batch_size, drop_remainder=True).prefetch(1) # group into batches of batch_size and skip incomplete batch, prefetch the next sample to improve latency
  test_ds = test_ds.shuffle(1024) # create shuffled dataset by allocating a buffer size of 1024 to randomly draw elements from
  test_ds = test_ds.batch(batch_size, drop_remainder=True).prefetch(1) # group into batches of batch_size and skip incomplete batch, prefetch the next sample to improve latency

  return train_ds, test_ds
3. 定义网络#
通过继承 Flax 模块,使用 Linen API 创建一个卷积神经网络。由于本示例中的架构相对简单 - 您只是堆叠层 - 您可以直接在 __call__ 方法中定义内联子模块,并用 @compact 装饰器将其包装起来。要详细了解 Flax Linen @compact 装饰器,请参阅 setup vs compact 指南。
from flax import linen as nn  # Linen API

class CNN(nn.Module):
  """A simple CNN model."""

  @nn.compact
  def __call__(self, x):
    x = nn.Conv(features=32, kernel_size=(3, 3))(x)
    x = nn.relu(x)
    x = nn.avg_pool(x, window_shape=(2, 2), strides=(2, 2))
    x = nn.Conv(features=64, kernel_size=(3, 3))(x)
    x = nn.relu(x)
    x = nn.avg_pool(x, window_shape=(2, 2), strides=(2, 2))
    x = x.reshape((x.shape[0], -1))  # flatten
    x = nn.Dense(features=256)(x)
    x = nn.relu(x)
    x = nn.Dense(features=10)(x)
    return x
查看模型层#
创建 Flax 模块的实例,并使用 Module.tabulate 方法通过传递 RNG 键和模板图像输入来可视化模型层的表格。
import jax
import jax.numpy as jnp  # JAX NumPy

cnn = CNN()
print(cnn.tabulate(jax.random.key(0), jnp.ones((1, 28, 28, 1)),
                   compute_flops=True, compute_vjp_flops=True))
                                  CNN Summary
┏━━━━━━━━━┳━━━━━━━━┳━━━━━━━━━━━━┳━━━━━━━━━━━┳━━━━━━━━━┳━━━━━━━━━━━┳━━━━━━━━━━━━┓
┃ path    ┃ module ┃ inputs     ┃ outputs   ┃ flops   ┃ vjp_flops ┃ params     ┃
┡━━━━━━━━━╇━━━━━━━━╇━━━━━━━━━━━━╇━━━━━━━━━━━╇━━━━━━━━━╇━━━━━━━━━━━╇━━━━━━━━━━━━┩
│         │ CNN    │ float32[1… │ float32[… │ 8708106 │ 26957556  │            │
├─────────┼────────┼────────────┼───────────┼─────────┼───────────┼────────────┤
│ Conv_0  │ Conv   │ float32[1… │ float32[… │ 455424  │ 1341472   │ bias:      │
│         │        │            │           │         │           │ float32[3… │
│         │        │            │           │         │           │ kernel:    │
│         │        │            │           │         │           │ float32[3… │
│         │        │            │           │         │           │            │
│         │        │            │           │         │           │ 320 (1.3   │
│         │        │            │           │         │           │ KB)        │
├─────────┼────────┼────────────┼───────────┼─────────┼───────────┼────────────┤
│ Conv_1  │ Conv   │ float32[1… │ float32[… │ 6566144 │ 19704320  │ bias:      │
│         │        │            │           │         │           │ float32[6… │
│         │        │            │           │         │           │ kernel:    │
│         │        │            │           │         │           │ float32[3… │
│         │        │            │           │         │           │            │
│         │        │            │           │         │           │ 18,496     │
│         │        │            │           │         │           │ (74.0 KB)  │
├─────────┼────────┼────────────┼───────────┼─────────┼───────────┼────────────┤
│ Dense_0 │ Dense  │ float32[1… │ float32[… │ 1605888 │ 5620224   │ bias:      │
│         │        │            │           │         │           │ float32[2… │
│         │        │            │           │         │           │ kernel:    │
│         │        │            │           │         │           │ float32[3… │
│         │        │            │           │         │           │            │
│         │        │            │           │         │           │ 803,072    │
│         │        │            │           │         │           │ (3.2 MB)   │
├─────────┼────────┼────────────┼───────────┼─────────┼───────────┼────────────┤
│ Dense_1 │ Dense  │ float32[1… │ float32[… │ 5130    │ 17940     │ bias:      │
│         │        │            │           │         │           │ float32[1… │
│         │        │            │           │         │           │ kernel:    │
│         │        │            │           │         │           │ float32[2… │
│         │        │            │           │         │           │            │
│         │        │            │           │         │           │ 2,570      │
│         │        │            │           │         │           │ (10.3 KB)  │
├─────────┼────────┼────────────┼───────────┼─────────┼───────────┼────────────┤
│         │        │            │           │         │     Total │ 824,458    │
│         │        │            │           │         │           │ (3.3 MB)   │
└─────────┴────────┴────────────┴───────────┴─────────┴───────────┴────────────┘

                       Total Parameters: 824,458 (3.3 MB)
4. 创建 TrainState#
Flax 中的常见模式是创建一个表示整个训练状态的单个数据类,包括步骤号、参数和优化器状态。
由于这是一种非常常见的模式,Flax 提供了类 flax.training.train_state.TrainState,它满足大多数基本用例。
!pip install -q clu
from clu import metrics
from flax.training import train_state  # Useful dataclass to keep train state
from flax import struct                # Flax dataclasses
import optax                           # Common loss functions and optimizers
我们将使用 clu 库来计算指标。有关 clu 的更多信息,请参阅 仓库 和 笔记本。
@struct.dataclass
class Metrics(metrics.Collection):
  accuracy: metrics.Accuracy
  loss: metrics.Average.from_output('loss')
然后,您可以继承 train_state.TrainState,使其还包含指标。这样做的好处是我们只需要将单个参数传递给 train_step() 之类的函数(见下文),即可一次性计算损失、更新参数和计算指标。
class TrainState(train_state.TrainState):
  metrics: Metrics

def create_train_state(module, rng, learning_rate, momentum):
  """Creates an initial `TrainState`."""
  params = module.init(rng, jnp.ones([1, 28, 28, 1]))['params'] # initialize parameters by passing a template image
  tx = optax.sgd(learning_rate, momentum)
  return TrainState.create(
      apply_fn=module.apply, params=params, tx=tx,
      metrics=Metrics.empty())
5. 训练步骤#
一个执行以下操作的函数:
使用
TrainState.apply_fn(包含Module.apply方法(前向传递))评估给定参数和一批输入图像的神经网络。使用预定义的
optax.softmax_cross_entropy_with_integer_labels()计算交叉熵损失。请注意,此函数需要整型标签,因此无需将标签转换为独热编码。使用
jax.grad评估损失函数的梯度。将梯度 pytree 应用于优化器以更新模型的参数。
使用 JAX 的 @jit 装饰器跟踪整个 train_step 函数,并使用 XLA 实时编译它,将其转换为融合的设备操作,这些操作在硬件加速器上运行得更快、更高效。
@jax.jit
def train_step(state, batch):
  """Train for a single step."""
  def loss_fn(params):
    logits = state.apply_fn({'params': params}, batch['image'])
    loss = optax.softmax_cross_entropy_with_integer_labels(
        logits=logits, labels=batch['label']).mean()
    return loss
  grad_fn = jax.grad(loss_fn)
  grads = grad_fn(state.params)
  state = state.apply_gradients(grads=grads)
  return state
6. 指标计算#
创建一个用于损失和准确度指标的单独函数。损失使用 optax.softmax_cross_entropy_with_integer_labels 函数计算,而准确度使用 clu.metrics 计算。
@jax.jit
def compute_metrics(*, state, batch):
  logits = state.apply_fn({'params': state.params}, batch['image'])
  loss = optax.softmax_cross_entropy_with_integer_labels(
        logits=logits, labels=batch['label']).mean()
  metric_updates = state.metrics.single_from_model_output(
    logits=logits, labels=batch['label'], loss=loss)
  metrics = state.metrics.merge(metric_updates)
  state = state.replace(metrics=metrics)
  return state
7. 下载数据#
num_epochs = 10
batch_size = 32

train_ds, test_ds = get_datasets(num_epochs, batch_size)
8. 播种随机性#
设置 TF 随机种子以确保数据集混洗(使用
tf.data.Dataset.shuffle)是可重复的。获取一个 PRNGKey 并将其用于参数初始化。(详细了解 JAX PRNG 设计 和 PRNG 链。)
tf.random.set_seed(0)
init_rng = jax.random.key(0)
9. 初始化 TrainState#
请记住,函数 create_train_state 初始化模型参数、优化器和指标,并将它们放入返回的训练状态数据类中。
learning_rate = 0.01
momentum = 0.9
state = create_train_state(cnn, init_rng, learning_rate, momentum)
del init_rng  # Must not be used anymore.
10. 训练和评估#
通过以下方式创建“混洗”数据集:
将数据集重复训练轮次的次数
分配一个大小为 1024 的缓冲区(包含数据集中的前 1024 个样本),从中随机抽取批次
每次从缓冲区中随机抽取样本时,将数据集中的下一个样本加载到缓冲区中
定义一个训练循环,该循环执行以下操作:
从数据集中随机抽取批次。
对每个训练批次运行一个优化步骤。
计算每个轮次中每个批次的平均训练指标。
使用更新的参数计算测试集的指标。
记录训练和测试指标以进行可视化。
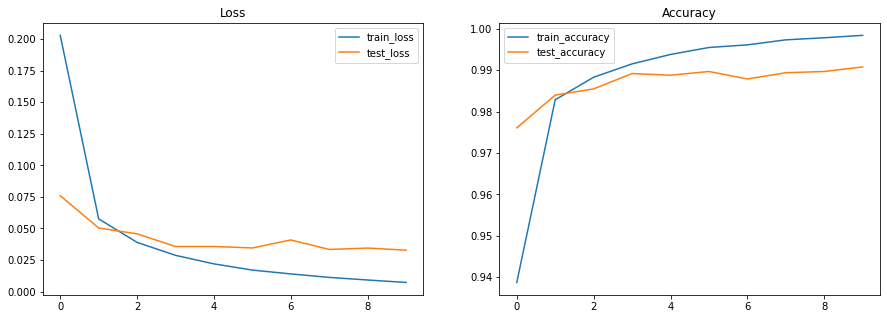
在完成 10 个轮次的训练和测试后,输出应显示您的模型能够达到大约 99% 的准确率。
# since train_ds is replicated num_epochs times in get_datasets(), we divide by num_epochs
num_steps_per_epoch = train_ds.cardinality().numpy() // num_epochs
metrics_history = {'train_loss': [],
                   'train_accuracy': [],
                   'test_loss': [],
                   'test_accuracy': []}
for step,batch in enumerate(train_ds.as_numpy_iterator()):

  # Run optimization steps over training batches and compute batch metrics
  state = train_step(state, batch) # get updated train state (which contains the updated parameters)
  state = compute_metrics(state=state, batch=batch) # aggregate batch metrics

  if (step+1) % num_steps_per_epoch == 0: # one training epoch has passed
    for metric,value in state.metrics.compute().items(): # compute metrics
      metrics_history[f'train_{metric}'].append(value) # record metrics
    state = state.replace(metrics=state.metrics.empty()) # reset train_metrics for next training epoch

    # Compute metrics on the test set after each training epoch
    test_state = state
    for test_batch in test_ds.as_numpy_iterator():
      test_state = compute_metrics(state=test_state, batch=test_batch)

    for metric,value in test_state.metrics.compute().items():
      metrics_history[f'test_{metric}'].append(value)

    print(f"train epoch: {(step+1) // num_steps_per_epoch}, "
          f"loss: {metrics_history['train_loss'][-1]}, "
          f"accuracy: {metrics_history['train_accuracy'][-1] * 100}")
    print(f"test epoch: {(step+1) // num_steps_per_epoch}, "
          f"loss: {metrics_history['test_loss'][-1]}, "
          f"accuracy: {metrics_history['test_accuracy'][-1] * 100}")
train epoch: 1, loss: 0.20290373265743256, accuracy: 93.87000274658203
test epoch: 1, loss: 0.07591685652732849, accuracy: 97.60617065429688
train epoch: 2, loss: 0.05760224163532257, accuracy: 98.28500366210938
test epoch: 2, loss: 0.050395529717206955, accuracy: 98.3974380493164
train epoch: 3, loss: 0.03897436335682869, accuracy: 98.83000183105469
test epoch: 3, loss: 0.04574578255414963, accuracy: 98.54767608642578
train epoch: 4, loss: 0.028721099719405174, accuracy: 99.15166473388672
test epoch: 4, loss: 0.035722777247428894, accuracy: 98.91827392578125
train epoch: 5, loss: 0.021948494017124176, accuracy: 99.37999725341797
test epoch: 5, loss: 0.035723842680454254, accuracy: 98.87820434570312
train epoch: 6, loss: 0.01705147698521614, accuracy: 99.54833221435547
test epoch: 6, loss: 0.03456473350524902, accuracy: 98.96835327148438
train epoch: 7, loss: 0.014007646590471268, accuracy: 99.6116714477539
test epoch: 7, loss: 0.04089202359318733, accuracy: 98.7880630493164
train epoch: 8, loss: 0.011265480890870094, accuracy: 99.73333740234375
test epoch: 8, loss: 0.03337760642170906, accuracy: 98.93830108642578
train epoch: 9, loss: 0.00918484665453434, accuracy: 99.78334045410156
test epoch: 9, loss: 0.034478139132261276, accuracy: 98.96835327148438
train epoch: 10, loss: 0.007260234095156193, accuracy: 99.84166717529297
test epoch: 10, loss: 0.032822880893945694, accuracy: 99.07852172851562
11. 可视化指标#
import matplotlib.pyplot as plt  # Visualization

# Plot loss and accuracy in subplots
fig, (ax1, ax2) = plt.subplots(1, 2, figsize=(15, 5))
ax1.set_title('Loss')
ax2.set_title('Accuracy')
for dataset in ('train','test'):
  ax1.plot(metrics_history[f'{dataset}_loss'], label=f'{dataset}_loss')
  ax2.plot(metrics_history[f'{dataset}_accuracy'], label=f'{dataset}_accuracy')
ax1.legend()
ax2.legend()
plt.show()
plt.clf()

<Figure size 600x400 with 0 Axes>
12. 在测试集上执行推理#
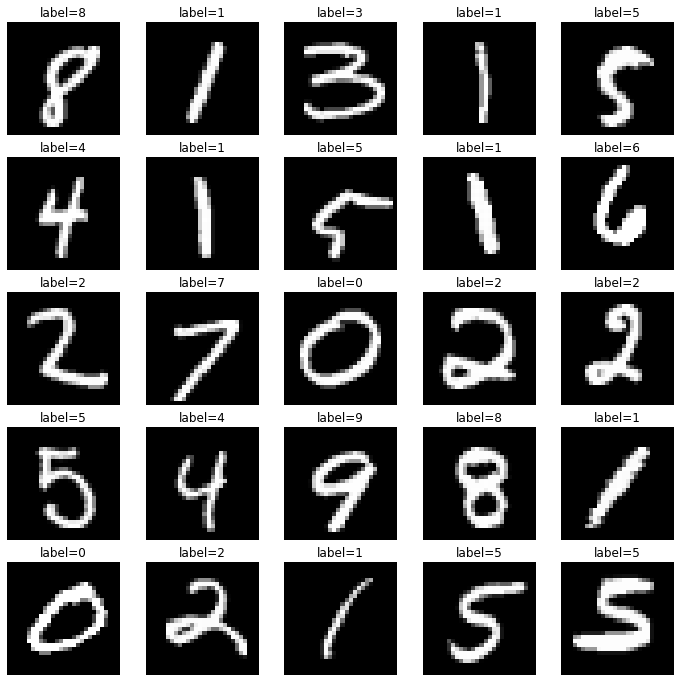
定义一个 jitted 推理函数 pred_step。使用学习到的参数对测试集进行模型推理,并可视化图像及其相应的预测标签。
@jax.jit
def pred_step(state, batch):
  logits = state.apply_fn({'params': state.params}, test_batch['image'])
  return logits.argmax(axis=1)

test_batch = test_ds.as_numpy_iterator().next()
pred = pred_step(state, test_batch)
fig, axs = plt.subplots(5, 5, figsize=(12, 12))
for i, ax in enumerate(axs.flatten()):
    ax.imshow(test_batch['image'][i, ..., 0], cmap='gray')
    ax.set_title(f"label={pred[i]}")
    ax.axis('off')

恭喜!您已经完成了带注释的 MNIST 示例。您可以重新访问同一个示例,但以不同的方式构建,例如作为几个 Python 模块、测试模块、配置文件、另一个 Colab 和 Flax Git 仓库中的文档


